Note
Click here to download the full example code
Test Plots of Vector Data (Created Using GeoPandas) with Matplotcheck
This vignette will show you how to use Matplotcheck to test plots of spatial vector data created using GeoPandas.
Import Packages
To begin, import the libraries that you need.
import matplotlib.pyplot as plt
import numpy as np
import pandas as pd
from shapely.geometry import Polygon, LineString
import geopandas as gpd
from matplotcheck.vector import VectorTester
Create Geometry Objects
To run this test, you must first plot some example data. Below are GeoPandas dataframes created to replicate data that may be used in an earth or environmental data science exercise. The polygons could be study areas, while the lines could be roads and streams near those study areas. The points could be measurements within the study areas.
# Create a polygon GeoDataFrame
coords = [(2, 4), (2, 4.25), (4.25, 4.25), (4.25, 2), (2, 2)]
coords_b = [(i[0]+5, i[1]+7) for i in coords]
polygon_gdf = gpd.GeoDataFrame(
    [1, 2], geometry=[Polygon(coords), Polygon(coords_b)], crs="epsg:4326")
polygon_gdf["attr"] = ["Area 1", "Area 2"]

# Create a line GeoDataFrame
linea = LineString([(1, 1), (2, 2), (3, 2), (5, 3)])
lineb = LineString([(3, 4), (5, 7), (12, 2), (10, 5), (9, 7.5)])
line_gdf = gpd.GeoDataFrame([1, 2], geometry=[linea, lineb], crs="epsg:4326")

# Create a multiline GeoDataFrame
linec = LineString([(2, 1), (3, 1), (4, 1), (5, 2)])
multi_line_gdf = gpd.GeoDataFrame(geometry=gpd.GeoSeries(
    [line_gdf.unary_union, linec]), crs="epsg:4326")
multi_line_gdf["attr"] = ["road", "stream"]

# Create a point GeoDataFrame
points = pd.DataFrame(
    {
        "lat": np.array([1, 2, 1, 0, 4]),
        "lon": np.array([3, 4, 0, 0, 1]),
    }
)

point_gdf = gpd.GeoDataFrame(
    {"A": np.arange(5), "B": np.arange(5)},
    geometry=gpd.points_from_xy(points.lon, points.lat), crs="epsg:4326"
)
point_gdf["size"] = [100, 100, 300, 300, 500]

# Create symbology dictionary to use in the legend
line_symb = {"road": "black", "stream": "blue"}
point_symb = {100: "purple", 300: "green", 500: "brown"}
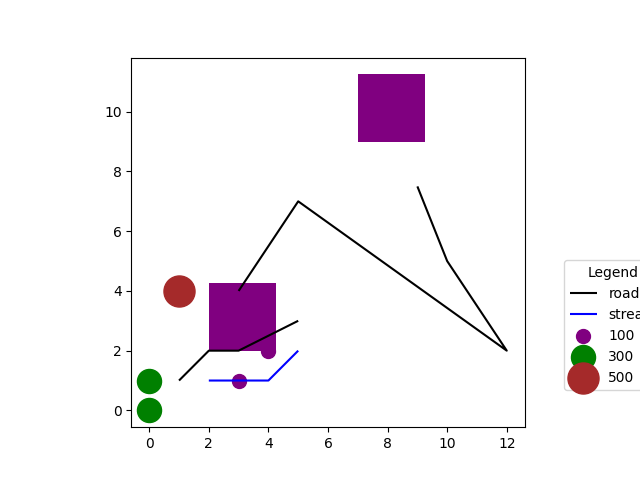
Create Your Spatial Plot
Above you created several GeoPandas GeoDataFrame objects that you want to plot. To plot these data according to attribute value, you can group the geometry by attributes and plot within a loop. Once you have created your plot, you will be ready to test it using Matplotcheck.
# Plot your data
fig, ax = plt.subplots()
polygon_gdf.plot(ax=ax, color="purple")

# Plot your line data by attributes using groupby
for ctype, lines in multi_line_gdf.groupby('attr'):
    color = line_symb[ctype]
    label = ctype
    lines.plot(color=color, ax=ax, label=label)

# Plot your points data by size using groupby
for ctype, points in point_gdf.groupby('size'):
    color = point_symb[ctype]
    label = ctype
    points.plot(color=color, ax=ax, label=label, markersize=ctype)

# Add a legend
ax.legend(title="Legend", loc=(1.1, .1));
Out:
<matplotlib.legend.Legend object at 0x7f5bf5f98c10>
Create A Matplotcheck VectorTester Object
Once you have created your plot, you can create a Matplotcheck VectorTester object that can be used to test elements in the plot by providing the ax object to the VectorTester function.
vector_test = VectorTester(ax)
Note
Each geometry type must be tested seperately in VectorTester. So, if your plot has multiple geometry types, such as lines, polygons, and points, make sure to check each geometry type separately.
Test Point Attribute Values and Geometry (x, y Locations)
You can check that both the position of the points on the plot and the associated point attribute values are accurate using assert_points(), assert_points_grouped_by_type() and assert_collection_sorted_by_markersize().
To check the geometry locations, you can call assert_points() and check the plot data against the expected points data, which in this case is the point_gdf object.
If the plot uses point markers that are sized by attribute value, you can check that the size of each marker correctly relates to an attribute value by providing the geometry (in this example, point_gdf), and the attribute the size is based off of, which is the ‘size’ column in this case.
# Check point geometry location (x, y location)
vector_test.assert_points(point_gdf)

# Check points are grouped plotted by type
vector_test.assert_points_grouped_by_type(point_gdf, "size")

# Check points size is relative to a numeric attribute value
vector_test.assert_collection_sorted_by_markersize(point_gdf, "size")
Note
Most tests are created as assert statements. Thus, if a test fails, Matplotcheck will return an error. If the test passes, no message is returned.
Test Line Attribute Values and Geometry (Coordinate Information)
You can also test the position and attributes of line geometries.
# Check line geometry
vector_test.assert_lines(multi_line_gdf)

# Check lines are plotted by type
vector_test.assert_lines_grouped_by_type(multi_line_gdf, "attr")
Testing Polygon Geometries
Currently, Matplotcheck is unable to check that polygons were plotted by type. Eventually this will be supported. For now, you can check that polygons are plotted correctly!
# Check Polygons
vector_test.assert_polygons(polygon_gdf)
Access Axes Objects in a Jupyter Notebook
Matplotcheck can be used to test plots in Jupyter Notebooks as well. The main difference is how you access the axes objects from the plot that you want to test. Below is an example of how you could access the axes of a plot you want to test in a Jupyter Notebook.
# First, import the Notebook module from Matplotcheck
import matplotcheck.notebook as nb

# Plot your data
fig, ax = plt.subplots()
polygon_gdf.plot(ax=ax, color="purple")

# Plot your line data by attributes using groupby
for ctype, lines in multi_line_gdf.groupby('attr'):
    color = line_symb[ctype]
    label = ctype
    lines.plot(color=color, ax=ax, label=label)

# Plot your points data by size using groupby
for ctype, points in point_gdf.groupby('size'):
    color = point_symb[ctype]
    label = ctype
    points.plot(color=color, ax=ax, label=label, markersize=ctype)

# Add a legend
ax.legend(title="Legend", loc=(1.1, .1));

# Here is where you access the axes objects of the plot for testing.
# You can add the code line below to the end of any plot cell to store all axes
# objects created by matplotlib in that cell.
plot_test_hold = nb.convert_axes(plt, which_axes="current")

# This object can then be turned into a VectorTester object.
vector_test = VectorTester(plot_test_hold)

# Now you can run the tests as you did earlier!

Total running time of the script: ( 0 minutes 1.140 seconds)