Note
Click here to download the full example code
The Basics of Testing Plots
These are some examples of using the basic functionality of MatPlotCheck.
Setup
You will start by importing the required packages. You will be using
matplotlib.pyplot to create our plots, but any matplotlib based
plotter (such as pandas.DataFrame.plot) can be used.
import matplotlib.pyplot as plt
import matplotcheck.base as mpc
import matplotcheck.notebook as nb
import pandas as pd
Plot
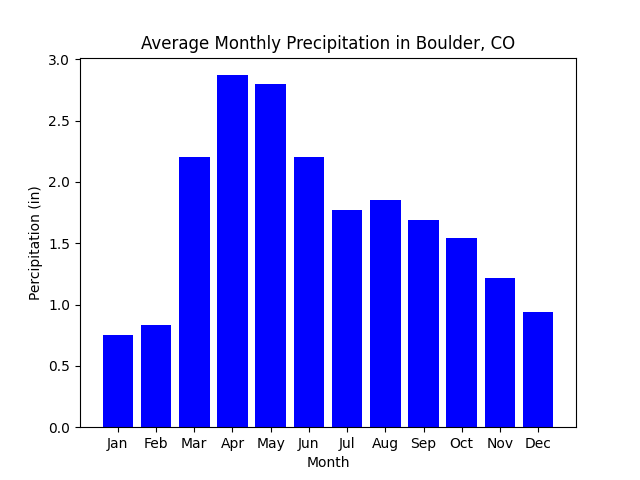
Now you will create some data and plot it.
months = [
    "Jan",
    "Feb",
    "Mar",
    "Apr",
    "May",
    "Jun",
    "Jul",
    "Aug",
    "Sep",
    "Oct",
    "Nov",
    "Dec",
]
percip = [
    0.75,
    0.83,
    2.2,
    2.87,
    2.80,
    2.20,
    1.77,
    1.85,
    1.69,
    1.54,
    1.22,
    0.94,
]

fig, ax = plt.subplots()
ax.bar(months, percip, color="blue")
ax.set(
    title="Average Monthly Precipitation in Boulder, CO",
    xlabel="Month",
    ylabel="Percipitation (in)",
)

plot_1_hold = nb.convert_axes(plt, which_axes="current")
Note
To use matplotcheck to test a plot, you need a copy of the
Matplotlib.axis.Axis object that the plot is stored in. This can be
prove difficult when testing plots in a Jupyter Notebook, where a
Matplotlib.axis.Axis object will not persisit beyond the cell it was
created in. In this case, nb.convert_axes() is used to hold the most
recently created plot in the variable plot_1_hold. There are other ways
to do this, but in a Jupyter Notebook you must use nb.convert_axes()
to save the Axis object.
Testing the plot
Now you can use matplotcheck to check that the plot has certain attributes
that you expect. You need to create a PlotTester object, and then you can
run some tests.
plot_tester_1 = mpc.PlotTester(plot_1_hold)


# Test that the plot is a bar plot
plot_tester_1.assert_plot_type("bar")

# Test that the plot title contains specific words
plot_tester_1.assert_title_contains(["average", "monthly precip", "boulder"])

# Test that the axis labels contain specific words
plot_tester_1.assert_axis_label_contains(axis="x", strings_expected=["month"])
plot_tester_1.assert_axis_label_contains(
    axis="y", strings_expected=["percip", "in"]
)
Now you can create a DataFrame to store the data that you expect to see in our plot. Then you test wether that data exists in the plot.
expected_x_data = [
    "Jan",
    "Feb",
    "Mar",
    "Apr",
    "May",
    "Jun",
    "Jul",
    "Aug",
    "Sep",
    "Oct",
    "Nov",
    "Dec",
]
expected_y_data = [
    0.75,
    0.83,
    2.20,
    2.87,
    2.80,
    2.20,
    1.77,
    1.85,
    1.69,
    1.54,
    1.22,
    0.94,
]
expected_data = pd.DataFrame(
    {"Months": expected_x_data, "Percip": expected_y_data}
)

plot_tester_1.assert_xydata(
    expected_data, xcol="Months", ycol="Percip", xlabels=True
)
Since no errors have been raised by the above assertions, you know that all those tests passed. Now you can run some tests that will fail.
# Test that the plot is a scatter plot
try:
    plot_tester_1.assert_plot_type("scatter")
except AssertionError as message:
    print("AssertionError:", message)

# Test that the title contains specific strings
try:
    plot_tester_1.assert_title_contains(["Denver", "wind speed"])
except AssertionError as message:
    print("AssertionError:", message)

# Test that the axis labels contain specific strings
try:
    plot_tester_1.assert_axis_label_contains(
        axis="x", strings_expected=["year"]
    )
except AssertionError as message:
    print("AssertionError:", message)
try:
    plot_tester_1.assert_axis_label_contains(
        axis="y", strings_expected=["wind speed"]
    )
except AssertionError as message:
    print("AssertionError:", message)
Out:
AssertionError: Plot is not of type scatter
AssertionError: Title does not contain expected string: Denver
AssertionError: x-axis label does not contain expected string: year
AssertionError: y-axis label does not contain expected string: wind speed
In some cases, you may not want the error message to display exactly what
words you are expecting. If you’d like to set your own error message for an
assertion, you can use the message flag. For more details, see the
documentation for base.assert_plot_type().
try:
    plot_tester_1.assert_plot_type(
        plot_type="line", message="Make sure you have the correct plot type!"
    )
except AssertionError as message:
    print("AssertionError:", message)
Out:
AssertionError: Make sure you have the correct plot type!
Note
Some assert functions use a slightly different flag to set a custom error message, and some have special functionality. See the documantation for details.
Total running time of the script: ( 0 minutes 0.641 seconds)