Note
Click here to download the full example code
Test Histogram Plots with Matplotcheck
Below you will find some examples of how to use MatPlotCheck to test histogram plots created with Matplotlib in Python.
Setup
You will start by importing the required packages and plotting a histogram.
Once you have created your plot, you will created a Matplotcheck
PlotTester object by providing the Matplotlib axis object to
PlotTester.
import matplotlib.pyplot as plt
import matplotcheck.base as mpc
import numpy as np
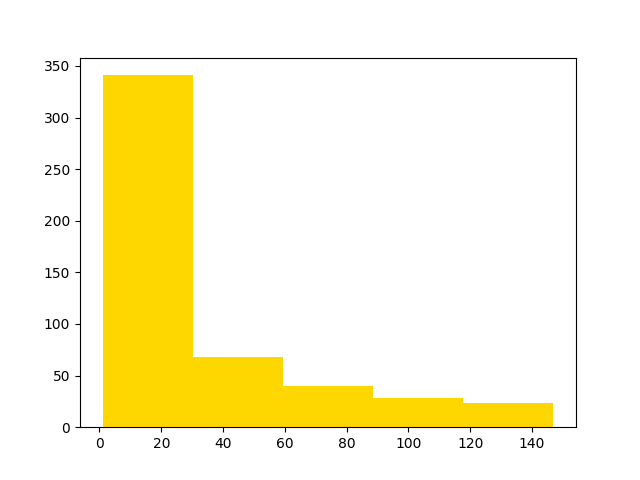
data = np.exp(np.arange(0, 5, 0.01))
fig, ax = plt.subplots()
ax.hist(data, bins=5, color="gold")
# Create a Matplotcheck PlotTester object
plot_tester_1 = mpc.PlotTester(ax)
Test a Histogram Plot
Once you have created a PlotTester object, you are ready to test various parts of your plot. Below, you test both the number of bins and the values associated with those bins.
Note
Throughout this vignette, the term bin value is used to describe the number of datapoints that fall within a bin. In other words, a bin’s value is equal to the height of the bar corresponding to that bin. For example, the value of the first bin in the above histogram is 341. Note that the height of the first bar is also 341.
# Test that the histogram plot has 5 bins
plot_tester_1.assert_num_bins(5)

# Test that the histogram bin values (the height of each bin) is as expected
expected_bin_values = [341, 68, 40, 28, 23]
plot_tester_1.assert_bin_values(expected_bin_values)
And you can also run some tests that will fail.
try:
    plot_tester_1.assert_num_bins(6)
except AssertionError as message:
    print("AssertionError:", message)

try:
    plot_tester_1.assert_bin_values([1, 4, 1, 3, 4])
except AssertionError as message:
    print("AssertionError:", message)
Out:
AssertionError: Expected 6 bins in histogram, instead found 5.
AssertionError: Did not find expected bin values in plot
Determining Expected Values
You can use the MatPlotCheck get_bin_values() method to extract the bin
values that are expected for a plot. This is helpful if you are using a tool
like nbgrader to create the the expected plot outcomes in a homework
assignment.
To extract bin values from an expected plot you first create the expected
histogram plot that you will use to grade your assignment (or htat you expect
as an outcome from a test). Next, you create a PlotTester object from that
plot. Finally, you call the get_bin_values() method to grab the expected
bin values from that plot.
The steps outlined above are implemented below.
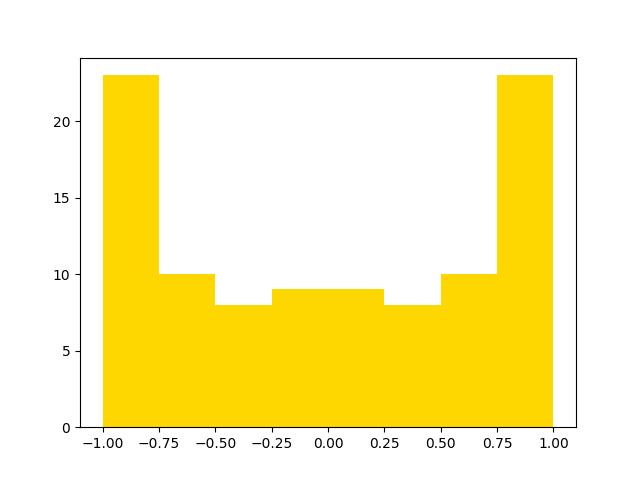
expected_data = np.sin(np.arange(0, 2 * np.pi, np.pi / 50))

# Create the expected plot
fig, ax = plt.subplots()
ax.hist(expected_data, bins=8, color="gold")

# Create a Matplotcheck PlotTester object from the axis object
plot_tester_expected = mpc.PlotTester(ax)
# Get bin values from the expected plot
print(plot_tester_expected.get_bin_values())
Out:
[23.0, 10.0, 8.0, 9.0, 9.0, 8.0, 10.0, 23.0]
This example assumes that you are creating tests for a student assignment. Once you have created the PlotTester object for the expected plot (this is the answer to the assignment that you expect the student to come to), you can then test the student plot to see if it matches expected bin values. Below another plot is created that represents the student submitted plot.
# Create and plot the student submitted histogram
data = np.sin(np.arange(2 * np.pi, 4 * np.pi, np.pi / 50))
fig, ax = plt.subplots()
ax.hist(data, bins=8, color="orange")

# Test the student submitted histogram bin values against the expected
# bin values (the correct answer to the assigned plot)
plot_tester_testing = mpc.PlotTester(ax)
plot_tester_testing.assert_bin_values(
    [23.0, 10.0, 8.0, 9.0, 9.0, 8.0, 10.0, 23.0]
)
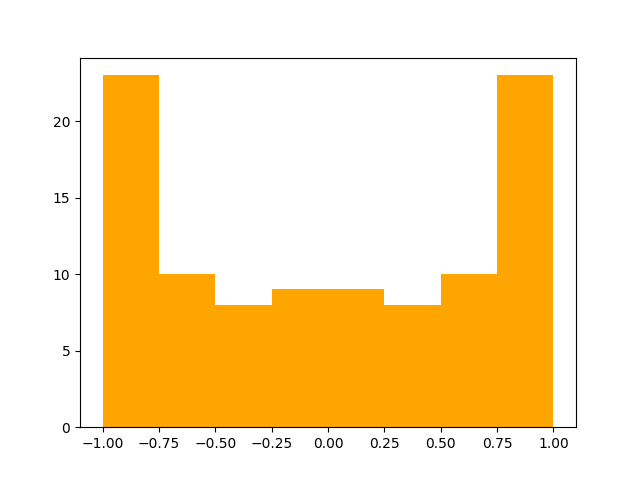
Above, assert_bin_values() did not raise an AssertionError. This
means that the test passed and the student submitted plot has the correct
histogram bins.
Note
In this example, you created the expected histogram (the homework answer) and the student submitted histogram in the same file.
Testing with Tolerances
In some cases, you might want to run a test that doesn’t require the bin
values to match exactly. For example, it might be ok if the values are
a few tenths off. To allow for some “wiggle room” in the expected answer,
you can use the tolerance parameter of the assert_bin_values()
method.
You will start by making two histograms with slightly different data and
storing the plots with nb.convert_axes(). The gold plot will serve as the
expected plot, and the orange plot will serve as the testing plot.
You will then create a PlotTester object for each plot. This allows you to extract the expected bin values from the expected plot and use those value to test the testing plot.
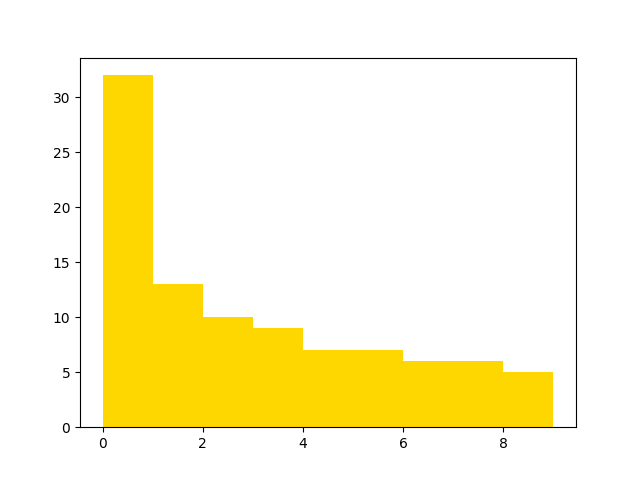
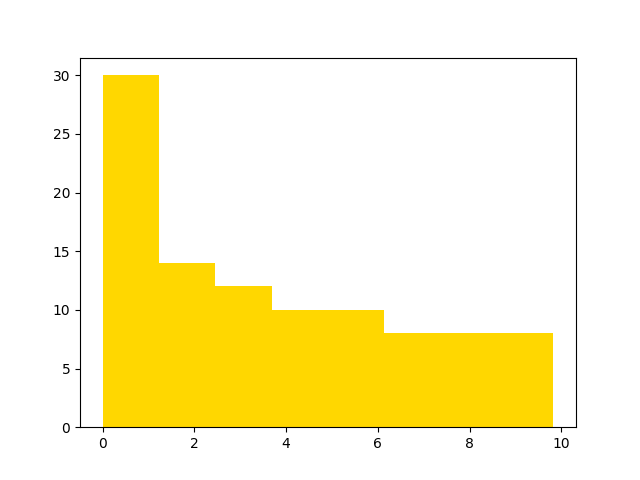
expected_data = 0.1 * np.power(np.arange(0, 10, 0.1), 2)
bins = np.arange(0, 10, 1)

fig1, ax1 = plt.subplots()
ax1.hist(expected_data, color="gold", bins=bins)

# Create plot tester object
plot_tester_expected_1 = mpc.PlotTester(ax1)
# Get expected bin values
bins_expected_1 = plot_tester_expected_1.get_bin_values()
test_data = 0.1995 * np.power(np.arange(0, 10, 0.1), 1.7)
fig2, ax2 = plt.subplots()
ax2.hist(test_data, color="orange", bins=bins)
# Create plot tester object
plot_tester_testing_2 = mpc.PlotTester(ax2)
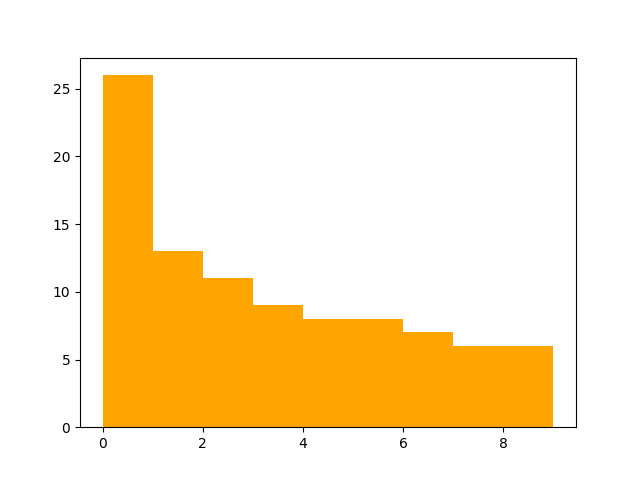
You’ll notice that the test (orange) plot differs somewhat from the expected (gold) plot, but still has a similar shape and similar bin values.
If you test it without the tolerance argument, the assertion will fail.
try:
    plot_tester_testing_2.assert_bin_values(bins_expected_1)
except AssertionError as message:
    print("AssertionError:", message)
Out:
AssertionError: Did not find expected bin values in plot
However, if you set a tolerance, the assertion can pass. Here you will test
it with tolerance=6, as that is the maximum difference between the two
datasets.
plot_tester_testing_2.assert_bin_values(bins_expected_1, tolerance=6)
Because no AssertionError is raised, you know that the test passed with
a tolerance of 0.2. However, the test will not pass with a tolerance that is
too small; the test will fail with tolerance=0.1.
try:
    plot_tester_testing_2.assert_bin_values(bins_expected_1, tolerance=0.1)
except AssertionError as message:
    print("AssertionError:", message)
Out:
AssertionError: Did not find expected bin values in plot
Note
When using tolerances, the tolerance argument is taken as a relative
tolerance. For more information, see the documentation for the
base.assert_bin_heights() method.
Test Histogram Midpoints
So far, you have tested the histogram values as well as the number of bins
the histogram has. It may also be useful to test that the data bins cover
the range of values that they were expected to. In order to do this, you can
test the midpoints of each bin to ensure that the data covered by each
bin is as expected. This is tested very similarly to the bins values.
Simply provide assert_bin_midpoints() with a list of the expected
midpoints, and it will assert if they are accurate or not. In order to obtain
the midpoints in a PlotTester object, you can use get_bin_midpoints(),
much like get_bin_values().
For this example, you will create a plot tester object from a histogram plot, the same way you did for the bin values example.
fig, ax = plt.subplots()
ax.hist(test_data, bins=8, color="gold")

# If you were running this in a notebook, the commented out  line below would
# store the matplotlib object. However, in this example, you can just grab the
# axes object directly.

# midpoints_plot_hold = nb.convert_axes(plt, which_axes="current")

plot_tester_expected_3 = mpc.PlotTester(ax)
print(plot_tester_expected_3.get_bin_midpoints())
Out:
[0.6143314487012252, 1.8429943461036757, 3.0716572435061265, 4.3003201409085765, 5.528983038311027, 6.757645935713478, 7.9863088331159275, 9.214971730518378]
You got the values from the plot tester object! As you can see, the values that were collected are the midpoints for the values each histogram bin covers. Now you can test that they are asserted indeed correct with an assertion test.
try:
    plot_tester_expected_3.assert_bin_midpoints(
        [-0.875, -0.625, -0.375, -0.125, 0.125, 0.375, 0.625, 0.875]
    )
except AssertionError as message:
    print("AssertionError:", message)
Out:
AssertionError: Did not find expected bin midpoints in plot
Here you can see that this will fail when given incorrect values.
try:
    plot_tester_expected_3.assert_bin_midpoints(
        [-0.75, -0.5, -0.25, -0, 0.25, 0.5, 0.75, 1]
    )
except AssertionError as message:
    print("AssertionError:", message)
Out:
AssertionError: Did not find expected bin midpoints in plot
Note
Keep in mind this test is for the midpoints of the range that each bin covers. So if a bin covers all data that’s in between 0 and 1, than the value given for that bin will be .5, not 0 or 1.
# .. note::
#   If you are working on tests for jupyter notebooks, you can call the
#   line below to capture the student cell in a notebook. Then you can
#   Use that object for testing.
#   testing_plot_2_hold = nb.convert_axes(plt, which_axes="current").
Total running time of the script: ( 0 minutes 0.508 seconds)